Outcome
Portfolio operators
More buildings than you can know, and a capital budget that funds a fraction of what is asked. Which building returns the most for the next unit of spend?
Why is an intensity table not a ranking?
kWh per square metre mixes climate, operating hours and use with performance. It promotes the busiest, hottest buildings whether or not any is run badly. Model each building against its own drivers first, then rank the gap in money.
Radr compares sites in one view, and states which tier of data each building sits in, so a coarse figure is never mistaken for a precise one.
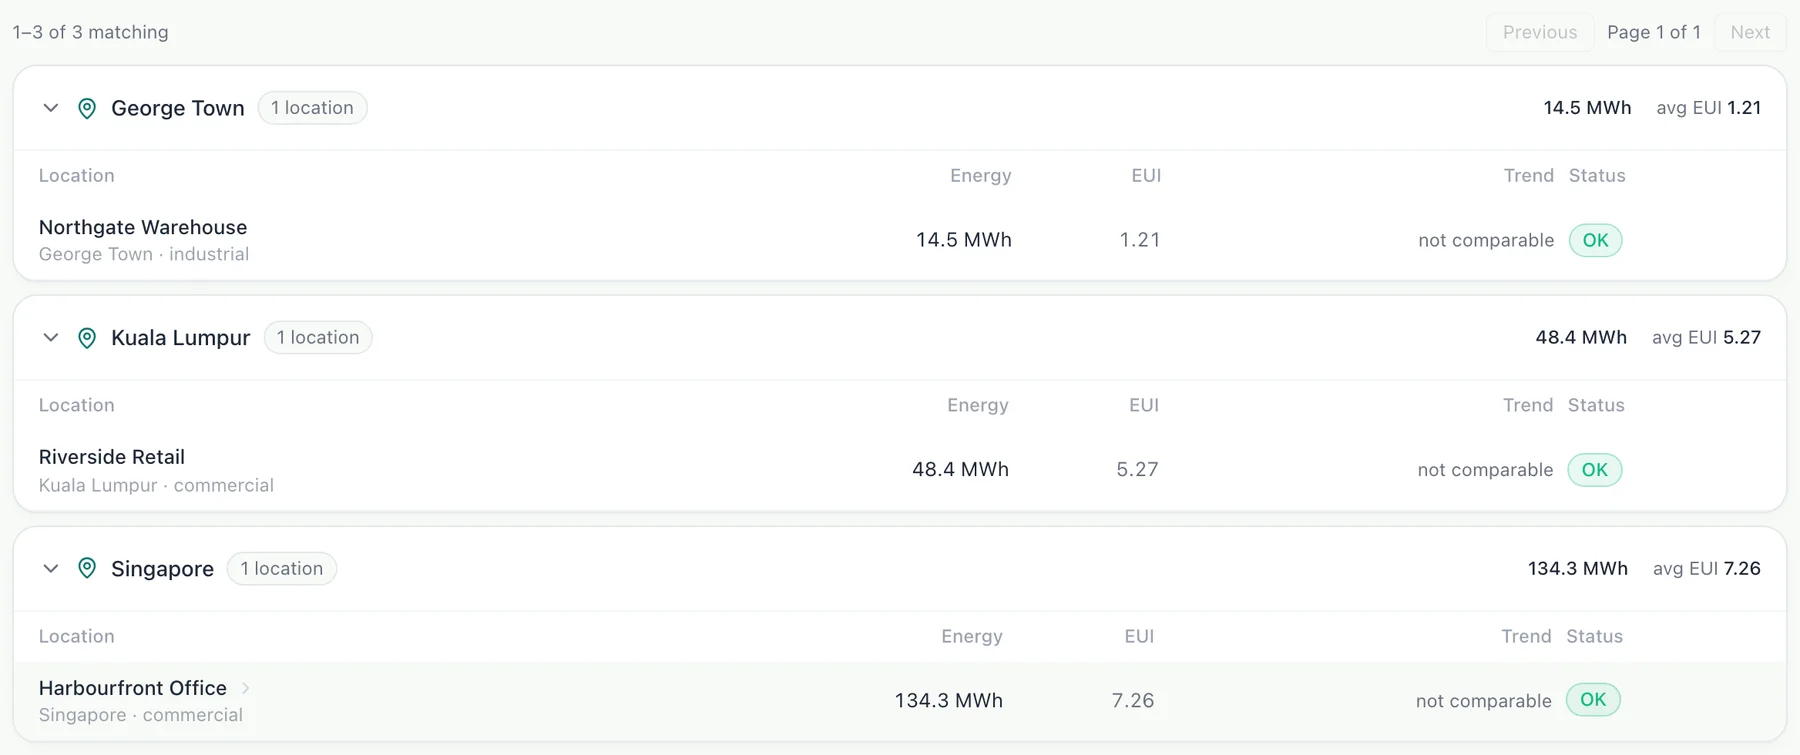
What does ranking by recoverable cost change?
What is checked before anything is ranked?
Duplicated buildings
One asset entered twice appears at half its size.
Dead meters
A stream that stopped looks like a building that improved.
Unmetered load
Plant outside the boundary makes a building look efficient.
Double-counting
A submeter and its parent in one total count a load twice.
Every figure states how many streams were examined. A real estate mixes sites with a BMS, a main meter or only an invoice; each is modelled to the detail its data allows. The method
Send us the estate list
Sites, meters and whatever data exists. We will say what can be ranked today.